


Spectroscopy Part 4 - Balmer Line identification in Vega
Continued from Part 3
This shows the position of the Hydrogen Alpha, Beta and Gamma Balmer Lines on my Vega Raw Spectrum.
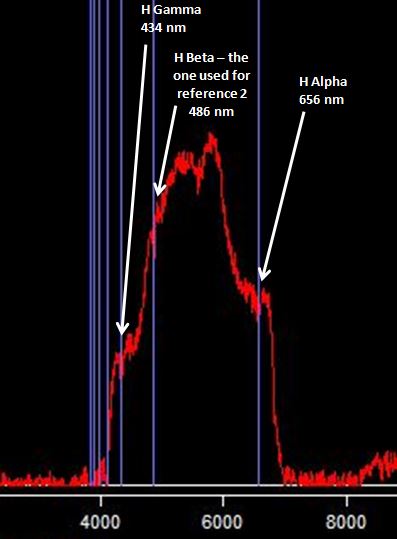
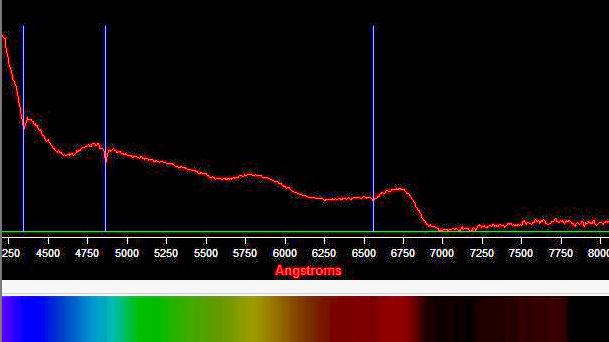
Even though calibrated this is still a raw spectrum because it is the Vega Spectrum modified by the spectral response of the camera. To see the true Vega spectrum I need to compensate for that. I used the RSpec software to determine the instrument response and then divided the above spectrum by that. This is the final Vega profile showing the Alpha Beta and Gamma lines again.(Right to Left)
So what can I get from this - well what is it that I am looking at.
First of all the Balmer lines are caused by Hydrogen in the atmosphere of Vega absorbing light at the particular line frequencies causing dips in the curve or black lines in the spectrum.
Secondly the shape of the continuous spectrum - the line graph - is defined by the temperature of the star. We are looking at part of a "black body Planck curve" that has a specific shape for a star at a particular temperature. In my spreadsheet I used the black body curve equation to generate the theoretical curve for Vega and matched it against the above observed Vega Spectrum
The plotted curve for Vega generated by my spreadsheet is shown below. The wavelength axis is in nanometres rather than Angstroms. The Vega (coloured) spectrum is shown at the bottom explaining why we are only seeing part of the Planck Curve.
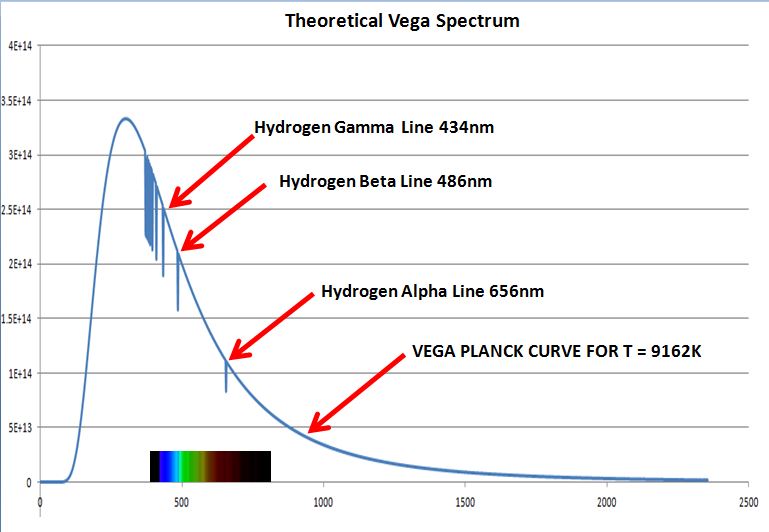
The curve comes to a peak that indicates a temperature of 9162k. There is a simple formula connecting the wavelength of the peak of a Planck curve with stellar surface temperature.
THE END
 [Your Name Here]