


Day 183 Sunday 28th September 2014. Using NGC 7790 images to find Transform values for my photometry setup
Still bad weather - cloudy - no observing today.
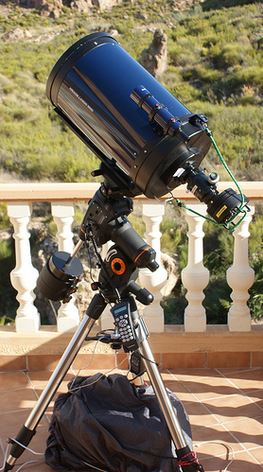
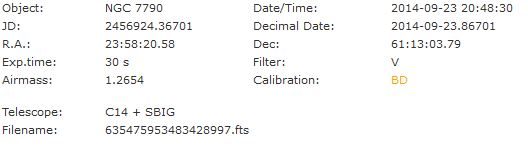
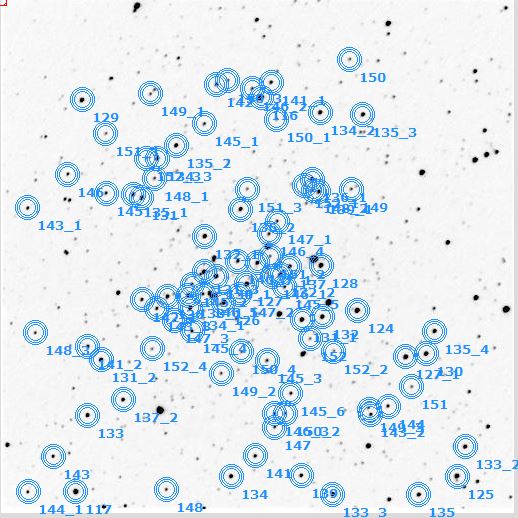
The negative V image of NGC 7790 (taken last Tuesday on my C14) uploaded to VPhot is shown below
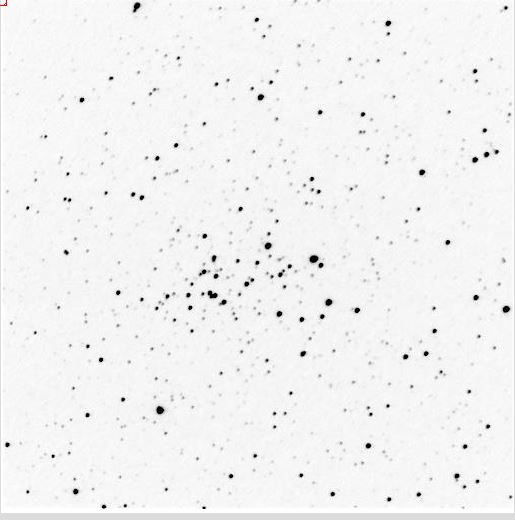
There is a standard chart for this field
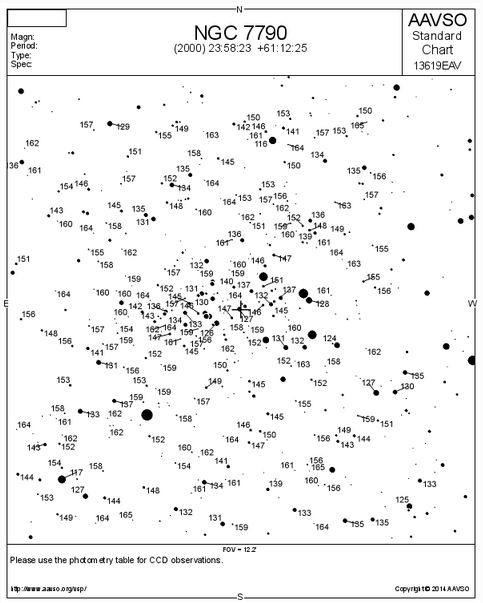
These standard V stars are superimposed on the VPhot negative image
Getting a photometric solution with no target will list all of the stars circled in terms of their instrumental V magnitudes. The red magnitude values can be ignored. The signal to noise ratio is significant. The Air Mass indicates how high the object is in the sky - the lower the better.
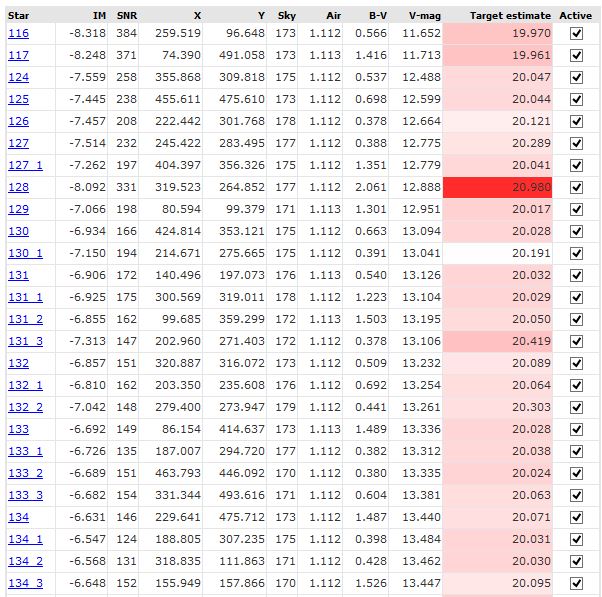
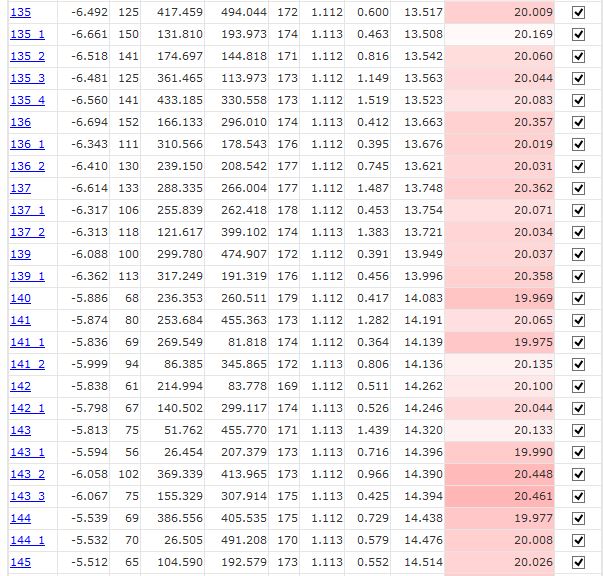
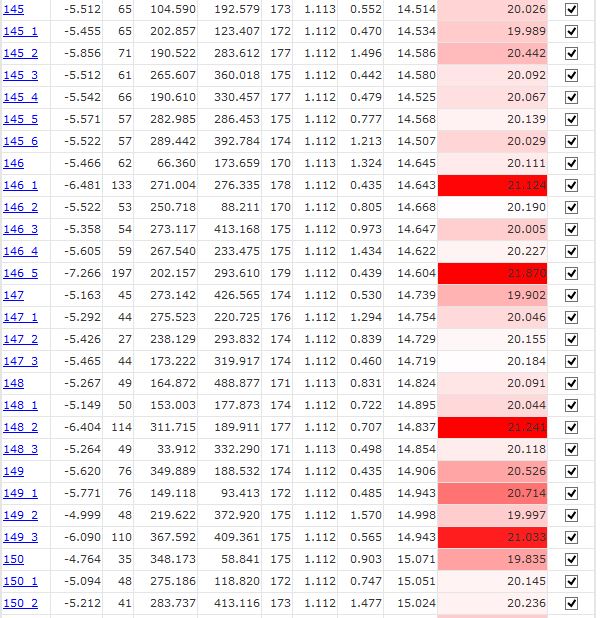
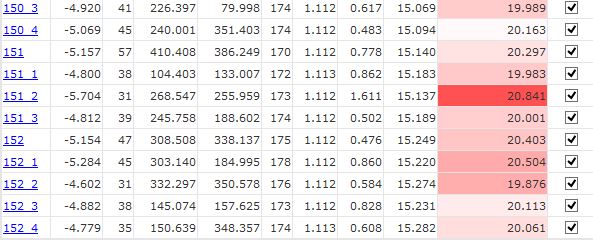
Without going into the details the same process is used for the B image producing a table of B instrumental magnitudes for the same stars.
I used Excel to produce graphs as follows based on the data from the B and V lists of instrumental magnitudes.I did not use all of the stars and excluded those with lower signal to noise ratios.
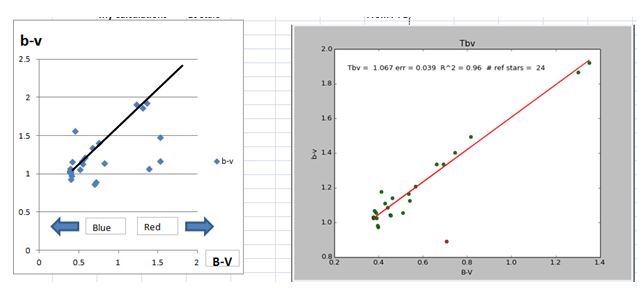
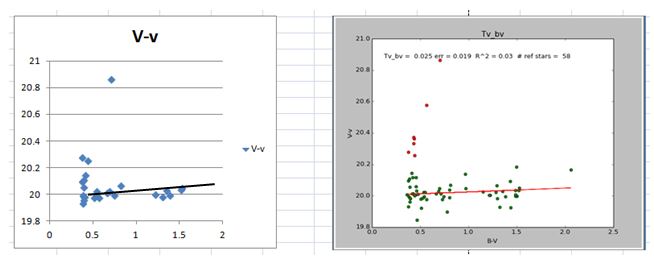
I produced the graph on the left (above) from the instrumental magnitudes determined from my B and V images and the standard B and V magnitudes for the stars. Plotting b-v against B-V shows the difference between standard values and values that my equipment will produce, allowing a "fiddle factor", sorry Transformation Coefficient to be introduced in future photometric measurements, The graph on the right is produced automatically by a downloadable AAVSO programme based on my results. The Transform Coefficient Tbv which is the inverse slope of the graph is 1.067.
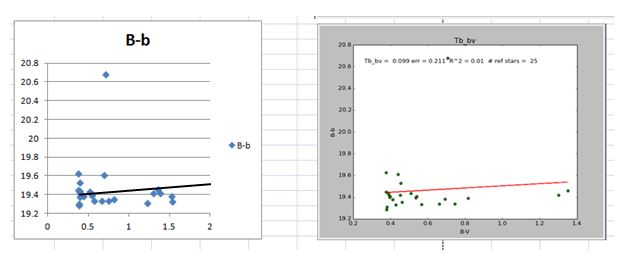
These charts show how the measured b and B values differ depending upon the colour of the star - the slope of the graph providing another correcting factor - thus one is called Tb and has a value of 0.099 for my equipment. If there was no change with colour then the line would be horizontal.
Similarly for Tv giving a value of 0.025 for my photometric arrangement.
 [Your Name Here]