

Day 154 Friday 22nd August 2014 186 galaxies imaged for SN Patrol. Spectacular galaxy in Pegasus NGC 7814
SN Patrol: 186 galaxies were imaged as part of my Supernova Patrol
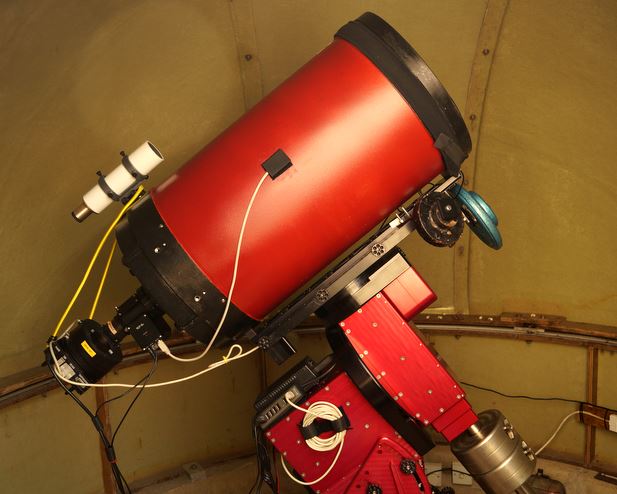
NGC 7814
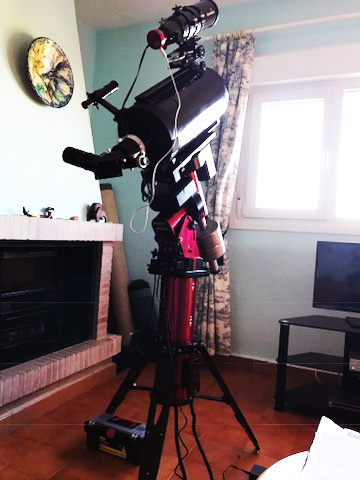
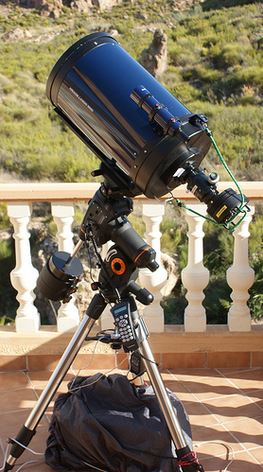
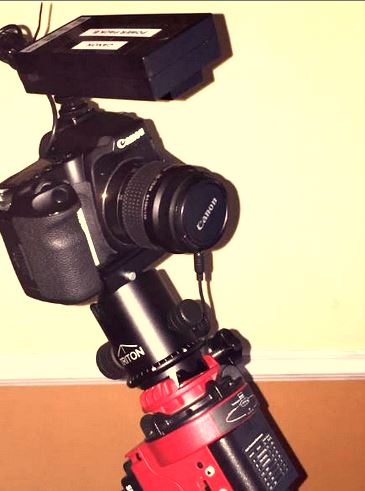
5 minute exposure ST9XE using C14
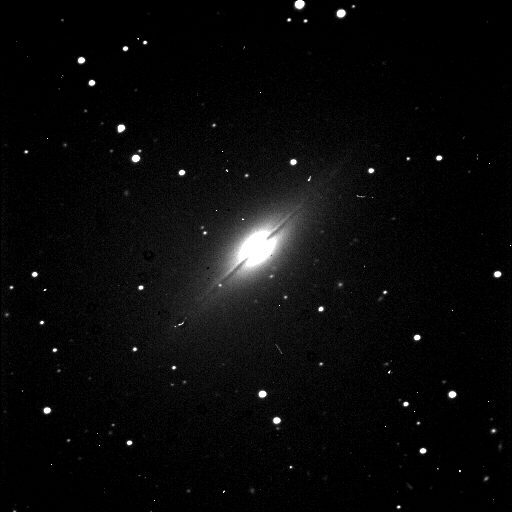
The galaxy is also known as PGC 218
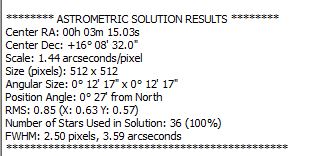
This is the plate solution
and the image superimposed on the chart shows the presence of other galaxies.
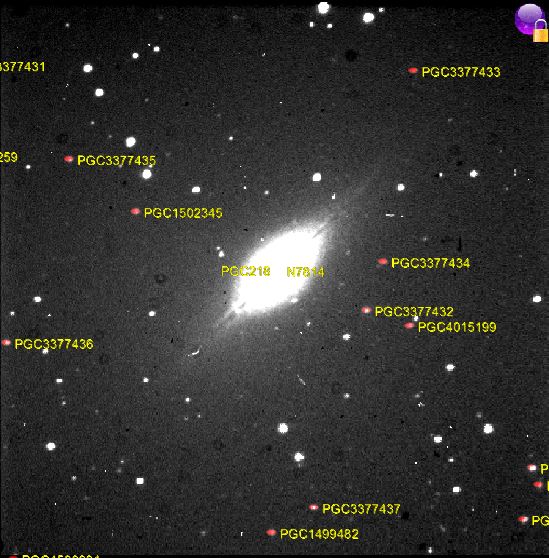
The Radial Velocity of NGC 7814 is 1292 km/s whereas the radial velocity of PGC 1499482 is 11428 km/s showing that the latter galaxy is about 10 times further away than the former. All is explained here:
 Copyright © Michael Richmond. This work is licensed under a Creative Commons License.
A connection between radial velocity and distance
Measuring Radial Velocity
If we send the light from a star or galaxy through a prism, it breaks up into a spectrum, with short wavelength (blue light) at one end, and long wavelengths (red light) at the other:

Superimposed on the spectrum of a star (or galaxy) are a series of dark lines. These absorption lines mark wavelengths at which gases in the star's outer atmosphere have absorbed light. Different gases absorb light of different wavelengths. In fact, one can identify particular elements in the spectrum of a star (or galaxy) by the wavelengths of light which are absorbed.
We can measure the wavelengths at which each element absorbs light in a lab, here on Earth. The element calcium, for example, aborbs light of wavelengths
- 393.3 nanometers -- the K line
- 396.8 nanometers -- the H line
Now, it turns out that if the material absorbing light is moving towards or away from us with some radial velocity, we see shifts in the location of the absorption lines:
- material moves towards us: shift to shorter wavelengths (blue)
- material moves away from us: shift to longer wavelengths (red)
This is called the Doppler effect. The size of the shift in the lines depends on the size of the radial velocity. For relatively small velocities,
                                             radial velocity
     shift (nm)   =  rest wavelength (nm) *  ---------------
                                             speed of light
Thus, for the calcium H and K lines,
     radial velocity       calcium K       calcium K
  ------------------------------------------------------
         0  km/sec          393.3 nm        396.8 nm

       100  km/sec          393.4           396.9

      1000  km/sec          394.6           398.1

    10,000  km/sec          406.4           410.0
Motions of stars and galaxies -- the early days
We can measure the speed of stars in our own Milky Way, as they orbit around the center of the galaxy. Most of the nearby stars follow paths which are similar to the Sun's. Like cars all going the same way along the highway, they appear to move past us relatively slowly: we measure speeds of around 30 to 50 km/sec, relative to the Sun. Occasionally, we find a star with a much higher speed: up to 220 km/sec. These "speeders" are not part of the disk, but part of our galaxy's halo. They fly far above and far below the plane of the disk, and zoom through the disk at very high speeds.
In the early twentieth century, the construction of big telescopes at Mount Wilson (the 60-inch and 100-inch) allowed astronomers to determine the motions of galaxies for the first time.
Measuring these radial velocities wasn't easy. Even nearby galaxies are relatively faint, and, unlike stars, their light is spread out over an extended area. Milton Humason used the 100-inch telescope on Mt. Wilson to obtain a spectrum of NGC 7619 in 1929, which yielded the largest radial velocity ever seen (up to that time): 3779 km/sec away from us. His paper describes the difficulties in an understated manner:
During the past year two spectrograms of N. G. C. 7619 were obtained with Cassegrain spectrograph VI attached to the 100-inch telescope. This spectrograph has a 24-inch collimating lens, two prisms, and a 3-inch camera, and gives a dispersion of 183 Angstroms per millimeter at 4500. The exposure times for the spectrograms were 33[h] and 45[h], respectively.
At six hours per night, each exposure took at least five nights!
Hubble's diagram
Edwin Hubble studied galaxies, using the biggest telescopes in the world (then at Mount Wilson). He photographed nearby galaxies and tried to find ways to determine their distances. In the nineteen-twenties, his best method (and it wasn't a great one) was based on the brightest stars in a galaxy. He assumed that the brightest stars were all of the same absolute luminosity, or standard candles; by comparing the apparent brightness of the brightest stars in different galaxies, he could calculate the distances.
It turns out that Hubble made several errors in his distance measurements; one of the most serious was mistaking compact clouds of glowing gas -- HII regions -- in some galaxies for the brightest stars in them. Although his relative distances weren't bad, his absolute distances were all much too small.
When Hubble plotted the velocities of nearby galaxies against their distances, he found a strong correlation:
Hubble used the slope of the line in this diagram to determine what has become known as the Hubble constant:
                  radial velocity  (km/sec)
       H0   =    --------------------------
                       distance  (Mpc)
More recent measurements, using the Surface Brightness Fluctuation technique, show a similar correlation, but yield a much smaller value of H0.
Indirect evidence for distance/velocity connection far away
When we look at distant galaxies, we can see the absorption lines shift by very large amounts:
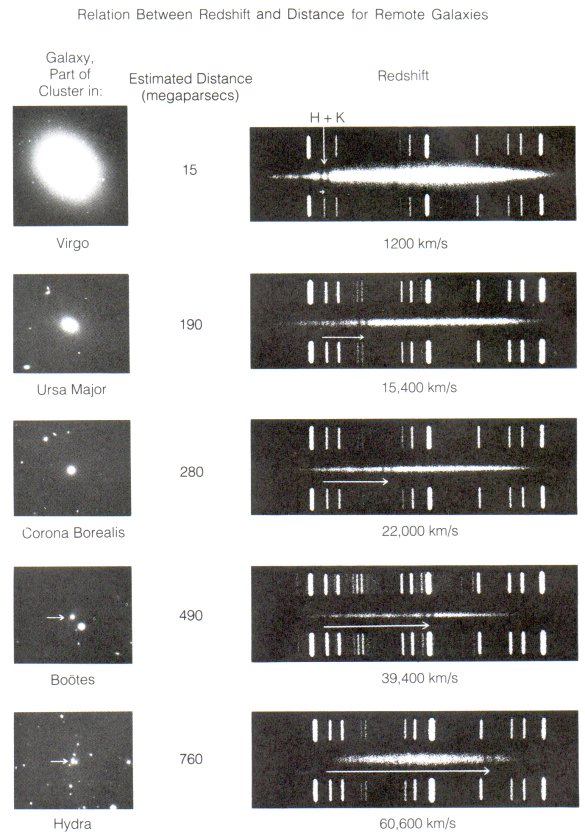
This tells us that the galaxies are moving away from us at very large speeds. Unfortunately, at these very large distances, we can't measure distances accurately.
But if we are willing to accept a few extra assumptions, we can look much farther into the universe to see if the radial velocity of objects continues to increase linearly with their (assumed) distance.
If all Type Ia supernovae have the same absolute luminosity, and if the radial velocities of their host galaxies rise linearly with distance, then a plot of their magnitude (logarithm of brightness) versus (logarithm of) redshift should be a straight line. A big survey of supernovae by astronomers in Chile (Hamuy et al., AJ 112, 2398, 1996) shows the expected correlation:
If all Brightest Cluster Galaxies have the same absolute luminosity, and if the radial velocity of a galaxy rises linearly with distance, then a plot of their magnitude (logarithm of brightness) versus (logarithm of) redshift should be a straight line. Recent work by Collins and Mann (MNRAS 297, 128, 1998) shows this to be the case, at least roughly:
Radial Velocity and Redshift
Astronomers often use radial velocity as a stand-in for distance. For example, you may hear an astronomer say,
"Hey, Jane, how distant is the Coma Cluster?"
"About 7,000 kilometers per second."
"Rats, that's too far for us to use the TRGB technique ..."
But there's another quantity, related to radial velocity, which astronomers use even more frequently: redshift. We use it because it is what we actually measure from spectra: the factor by which absorption or emission lines are shifted from their rest values.
                        observed wavelength
       redshift  z   =  -------------------  -  1
                          rest wavelength
So, for example, if we know that the K-line of calcium has a rest wavelength of 393.3 nanometers, and we observe it in the spectrum of a faint galaxy at a wavelength of 550.0 nanometers, then
                          550.0 nm
       redshift  z   =   ----------  -  1
                          393.3 nm

                     =      1.40     -  1

                     =      0.40
For very distant objects, moving at very high speeds away from us, we sometimes see redshifts greater than one. How is this possible? Is the galaxy moving faster than the speed of light?
No. At very high speeds, the Doppler shift formula changes slightly. The low-speed formula
                                             radial velocity
     shift (nm)   =  rest wavelength (nm) *  ---------------
                                             speed of light
can be re-arranged to give the radial velocity for some observed shift in wavelength:
                                                 shift
     radial velocity  =  (speed of light)  * ---------------
                                             rest wavelength


                      =  (speed of light)  *   z
For large shifts, one must include the effects of special relativity, which result in
                                                      2
                                               (z + 1)  - 1
     radial velocity  =  (speed of light)  *  [------------ ]
                                                      2
                                               (z + 1)  + 1
So, for example, the most distant quasar yet measured has a spectrum which shows the Lyman-alpha emission line (normally at 121.6 nm = 1216 Angstroms) at a shifted wavelength of about 8300 Angstroms:
The quasar thus has a redshift of
                        observed wavelength
       redshift  z   =  -------------------  -  1
                          rest wavelength

                         8300 Angstroms
                     =  ----------------  - 1
                         1216 Angstroms


                     =   5.82
And its radial velocity is therefore
                                                      2
                                               (z + 1)  - 1
     radial velocity  =  (speed of light)  *  [------------ ]
                                                      2
                                               (z + 1)  + 1


                                              (6.82*6.82) - 1
                      =  (300,000 km/sec)  *  --------------
                                              (6.82*6.82) + 1


                      =  (300,000 km/sec)  *   0.958


                      =   287,000 km/sec
For further information, see
- A scientific biography of Edwin Hubble written by Allan Sandage, his successor at Mount Palomar.
- Hubble's first announcement of the distance/radial velocity relationship, a paper published by the National Academy of Sciences in 1929.
- An experiment in which you (yes, you) can measure the Hubble constant using galaxies in the Hubble Deep Field. This is way cool, but does require Java and may be a bit slow, since it's hosted in England. Thanks to Ian Smail, at the University of Dunham.
- The LCRS galaxy redshift survey has a nice picture showing how astronomers now use the redshift of a galaxy as a stand-in for its distance.
Copyright © Michael Richmond. This work is licensed under a Creative Commons Licence
 [Your Name Here]